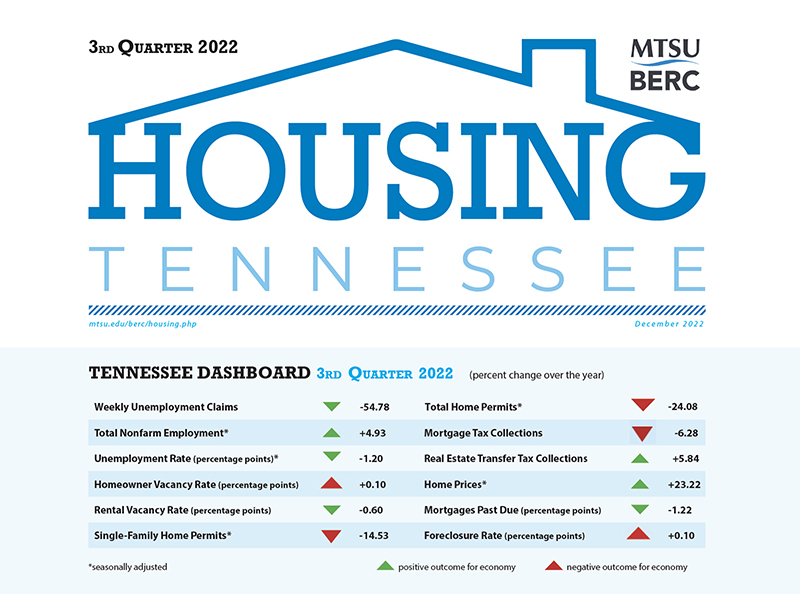
Middle Tennessee State University’s latest “Housing Tennessee” report shows a mixed bag of leading economic indicators, with home prices continuing their rise overall but declining numbers of single-family and total building permits along with drops in home closings may indicate a tightening economy across the Volunteer State.
The MTSU Business and Economic Research Center’s statewide report for the third quarter of 2022 reveals a 24% year-over-year drop for all construction permits and drops in closings across all three regions of the state, noted report author Murat Arik, director of the BERC at MTSU.

Home prices continue to rise, though not at briskly, and weekly unemployment claims, jobs numbers, rental vacancy rate, real estate transfer tax collections, and mortgages past due “show signs of improvements from the previous year.”
However, there are areas of concern: homeowner vacancy rates, foreclosure rates, mortgage tax collections, and single-family and total home permits suggest potential tightening in the economy.
Other report highlights:
• Home prices for all MSAs in Tennessee increased, though not as much as in the second quarter, except for the Morristown MSA, which grew 25% in home prices (three percentage points higher). The Memphis MSA had the smallest annual growth of 17.3%.

Both Tennessee and the United States experienced an increase in home prices from the previous quarter. The growth rate in Tennessee was nearly twice as large as the growth rate in the United States. Annually, both Tennessee and the United States recorded increases in home prices by 23.2% and 16.5%, respectively.
Since the first quarter of 2021, home price increases in Tennessee have been faster than the increase in the United States, reversing the trend in the last two decades.
• Tennessee’s single-, multi-family and total home permits all fell both quarterly and yearly. Quarterly and yearly total permits decreased in all observed regions. Tennessee’s quarterly decline was the most significant at 12.3%, while the South and the United States were 7.5% and 6.7%, respectively. Annually, total permits declined by 24% in Tennessee. The South and the United States had yearly decreases of 2.84% and 5.5%, respectively.

• Quarterly and year-over-year closings for the Nashville, Knoxville, and Memphis regions “were all negative.” The Nashville area experienced the most significant quarterly decrease of 12.6%, while the Knoxville and Memphis area had declines of 7.3% and 6.3%, respectively. Annual changes in closings were most significant for Nashville and Knoxville, each with decreases of roughly 16.4%. Memphis saw a reduction of 11.7% in annual closings.
• Inventories are up noticeably, with Nashville having the largest quarterly growth of 36.5%, followed by Knoxville with 19.7% and Memphis with 16.5%. For annual inventory changes, Nashville similarly had the most significant increase at 76%. Knoxville observed a 50.8% yearly expansion in inventory, and Memphis saw a more moderate rise of 9.5%.
See the full report and more detailed breakdowns at https://www.mtsu.edu/berc/housing/.
BERC’s report is funded by Tennessee Housing Development Agency, or THDA. The quarterly report offers an overview of the state’s economy as it relates to the housing market and includes data on employment, housing construction, rental vacancy rates, real estate transactions and mortgages, home sales and prices, delinquencies and foreclosures.
The Business and Economic Research Center operates under the Jennings A. Jones College of Business at MTSU. For more information, visit http://mtsu.edu/berc/.
About THDA
THDA is the state’s housing finance agency and is committed to expanding safe, sound, affordable housing opportunities for low- and moderate-income Tennesseans. This is achieved through a robust home loan program, competitive funding for local nonprofit and municipal agencies, and the administration of nine federally funded programs. THDA publishes research on affordable housing and THDA programs and beneficiaries. THDA also coordinates state planning for housing through the Consolidated Planning process, annual Action Plans, and annual Performance Reports. See http://thda.org for more information.


COMMENTS ARE OFF THIS POST