

Tennessee’s housing market data sees steady growth in the third quarter of 2021, according to the latest report from the Business and Economic Research Center at Middle Tennessee State University.
Mortgage tax collections, real estate transfer tax collections, and housing prices continue to increase exponentially, noted housing report author Murat Arik, BERC director and Jones Chair of Excellence in Regional and Urban Planning.

Dr. Murat Arik
Statewide data revealed continuing positive trends from previous quarters, but there were a few negative shifts in housing permits and rental vacancies. Single-family permits fell by 2.3%, while total housing permits fell by 5.7%, and the Tennessee rental vacancy rate increased by .8% since the second quarter.
Housing prices keep rising statewide
Housing prices for all MSAs in Tennessee saw annual increases.
- The smallest increase was in the Memphis MSA at 16.3%.
- The largest annual housing price increase came from the Chattanooga MSA, Jackson MSA, and the Knoxville MSA with 19%, 19.6%, and 20.6%, respectively.
- Statewide prices followed a pattern of exponential growth, with an annual housing increase of 18.7%. Quarterly housing prices for Q3 saw growth in the U.S. (5.1%) and in Tennessee (6.2%).
Home sales mixed
In home sales, closings for the Nashville, Knoxville, and Memphis regions had mixed quarterly and yearly outcomes.
- Nashville and Knoxville decreased in quarterly closings of .01% and 17.64%, while Memphis saw a quarterly increase of 3.45%.
- When considering annual changes, all three regions saw growth from 2020, in Nashville at 25.5%, Knoxville at 19.9%, and Memphis at 28.3%.
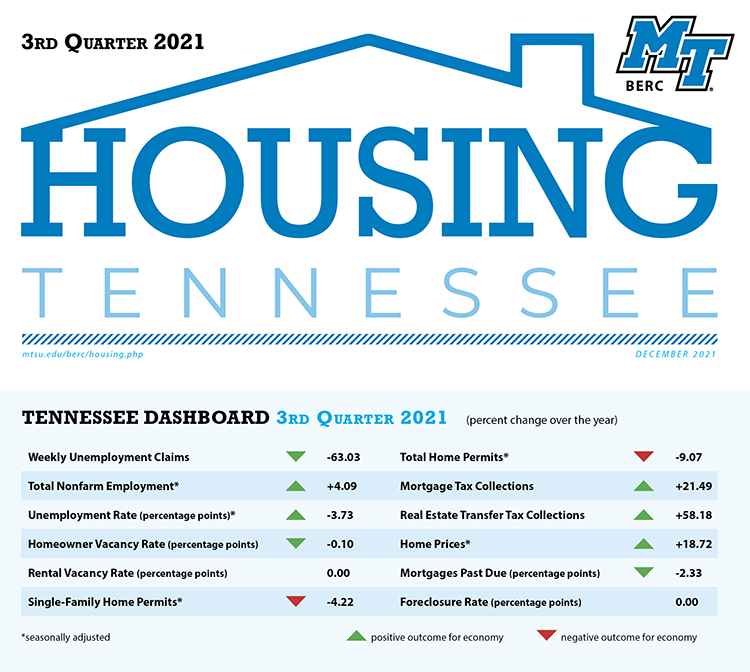
This chart shows year-over-year changes in the 2021 third quarter performance of the Tennessee housing market. (Courtesty of the MTSU Business and Economic Research Center)
Inventories growing
- Quarterly changes for inventory among the three regions all saw growth in available inventory. Nashville increased 7.6%, Knoxville increased 6.4%, and Memphis increased 10.4%.
- Annual inventory changes were strictly negative. Inventory for Nashville fell the most by 38.4%, while Knoxville and Memphis fell 19.6% and 11.4%, respectively.

Permits down statewide
- Single-family permits dropped 7.4% for the quarter and 4.2% over the year in Tennessee.
- The state also experienced a sharp quarterly decrease of 33.4% in multi-family permits, and a 19.7% drop from last year.
- Total permits had strictly negative quarterly outcomes, with declines of 16.7% for the quarter and 9.07% over the year.
Delinquencies, foreclosures on good trend
Mortgage delinquencies continued a downward trend in Tennessee and the U.S. in the third quarter. Mortgage delinquencies also fell annually in Tennessee (2.6%) and in the U.S. (2.3%). Both Tennessee and the U.S. saw a decrease of .01% in foreclosures on the quarterly level. Annual foreclosure rates for the U.S. and Tennessee did not change.
“Despite the foreclosure moratorium formally ending in July, foreclosures continue to hover close to zero percent (.03%). Mortgage delinquencies continued a downward trend to pre-COVID levels,” Arik noted.
A pdf version of the full report is available online at https://www.mtsu.edu/berc/docs/HousingTN.Q3.2021.pdf while a detailed dashboard of the report can be accessed at https://www.mtsu.edu/berc/housing/.
— Brian Delaney (Brian.Delaney@mtsu.edu) and Jimmy Hart (Jimmy.Hart@mtsu.edu)

COMMENTS ARE OFF THIS POST